Overview
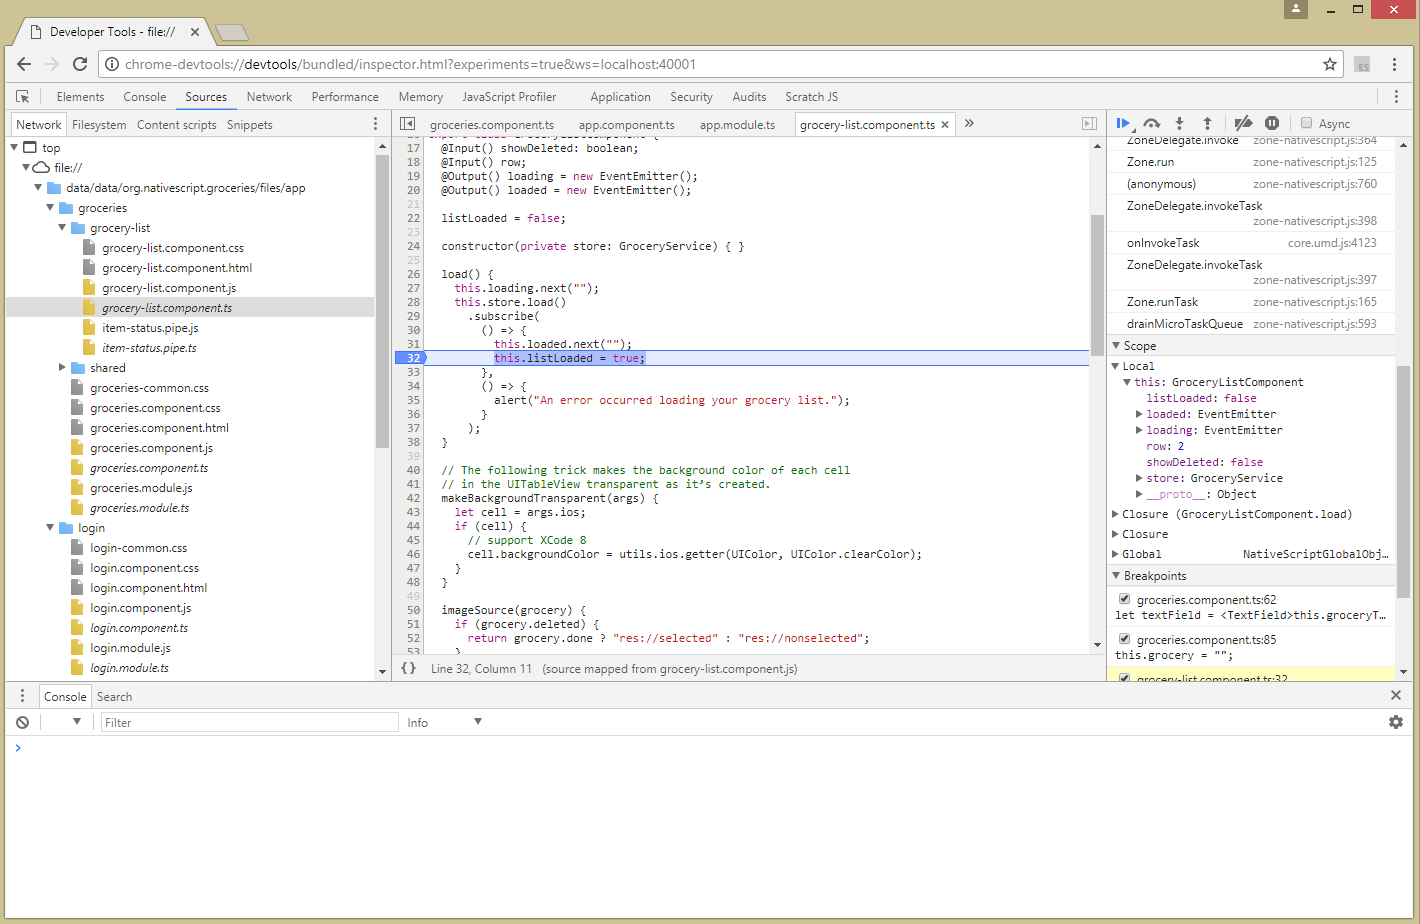
Since NativeScript for Android embeds a JavaScript virtual machine (namely Google's V8) to process the JavaScript code, it also takes advantage of the debugger tools available for this virtual machine - the Chrome Developer Tools.
The article assumes that you are familiar with JavaScript debugging in the Chrome Developer Tools. You will need the Chrome web browser installed locally.
The current implementation supports two major scenarios:
- Start debugging - starts an application with the debugger enabled
- Attach/Detach debugger - attach/detach the debugger to a running application
Start an application with the debugger attached
The following command will build, deploy and run the application with the debugger attached:
tns debug android
Behind the scenes the debug command will build and
start the target application and then it will find an available
port and enable V8's debugger on that port. Finally, you'll get
a url starting with chrome-devtools:// to
copy/paste into Chrome to start the debug session.

Features
- Breakpoint debugging, stepping
- Inline source maps support for transpiled code
- Console evaluation
Setting breakpoints in JavaScript
The global debugger sets a V8 breakpointIn the
script source. It is equivalent to setting a "manual" breakpoint
in the Sources tab of Chrome DevTools.
See this article for more information.
Attach the debugger
If you have a running application you can attach the debugger with the following command:
tns debug android --start
As in the previous scenario, the
debugcommand will configure the V8 debugger port, forward the port, and output a url to paste into Chrome.
Detach the debugger
Detaching the debugger is as simple as closing the chrome-devtools tab.
Notes
The current implementation has hard-coded 30 seconds timeout for establishing a connection between the command line tool and the device/emulator.
Debugging sources different than JavaScript (TypeScript, CoffeeScript, etc.) is only possible when source maps are inlined by the transpiler.