Debugging the Android Runtime
Overview
The Debug article shows how to debug the business logic of your application. But what happens when the problem is in the runtime? How do I debug the application and the runtime simultaneously?
Since {N} version 4.0 you can open your
<app_name>/platforms/android folder in
Android Studio, do a couple of simple configurations and debug
your application and the Android Runtime. This means you'll be
able to debug the C++ and Java side of the runtime and the
JavaScript business logic as you've done up to now.
Setting up the project for native debugging
Once you have your project up and running you can open the
<app-name>/platforms/android in Android
Studio.
Note: be sure you're using ^4.0 version of the Android Runtime if you want the following steps to work.
After you've open the project in Android Studio find the
settings.gradle file which should look like this:
Note: Before opening the project in Android Studio, you need to run at least
tns prepare android!
rootProject.name = "com.example.yourprojectname"
include ':app'//, ':runtime', ':runtime-binding-generator'

//project(':runtime').projectDir = new File("${System.env.ANDROID_RUNTIME_HOME}/test-app/runtime")
//project(':runtime-binding-generator').projectDir = new File("${System.env.ANDROID_RUNTIME_HOME}/test-app/runtime-binding-generator")

file("google-services.json").renameTo(file("./app/google-services.json"))
Uncomment the :runtime and
':runtime-binding-generator sub-projects. You can
either define ANDROID_RUNTIME_HOME environment
variable pointing to the path where you've cloned the
android runtime repository
or replace
${System.env.ANDROID_RUNTIME_HOME} with that
path. After all the changes the
settings.gradle should look like this:
rootProject.name = "com.example.yourprojectname"
include ':app', ':runtime', ':runtime-binding-generator'

project(':runtime').projectDir = new File('/c/your/android-runtime/test-app/runtime')
project(':runtime-binding-generator').projectDir = new File('/c/your/android-runtime/test-app/runtime-binding-generator')

file("google-services.json").renameTo(file("./app/google-services.json"))
Note the
project(':runtime').projectDirshould point to an already cloned and set-up android-runtime repo.
That's all, now you can debug the Java part of the runtime. Just
put a break point and hit debug.
If you want to debug the c++ part of the runtime, you should point the debug tool to the debug symbols.
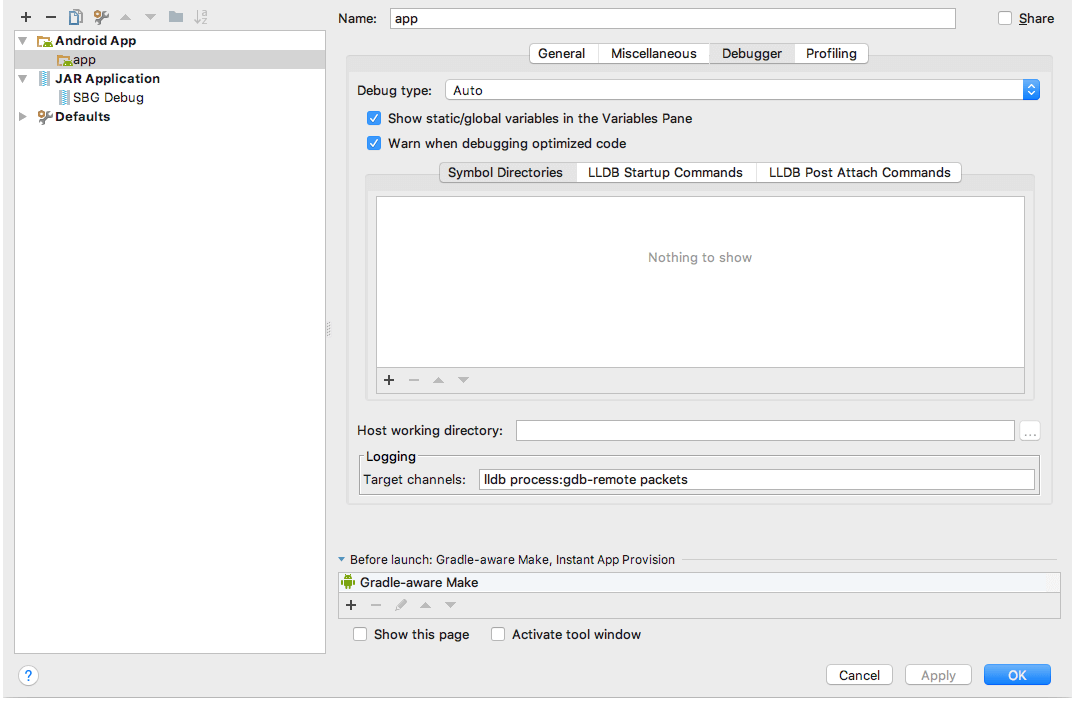
From Android Studio: Open the "Run" menu -> "Edit Configurations ..." -> The following screen will open:

Select the "Debugging" tab -> "Symbol Directories" -> Click on the "+" sign and add the path to the debug symbols. They should be at the following path, relative to the folder where the runtime is set up: "./android-runtime/test-app/runtime/build/intermediates/cmake/release/obj".
You can set a debug break point inside the c++ code and hit debug.
Debugging with chrome-dev-tools and Android Studio
It's a bit more tricky to debug your application as you're used
to through the CLI and chrome-dev-tools. First of all you need
to have the adb command available in the terminal.
Either that or access it through an environment variable like
so:
$ANDROID_HOME/platform-tools/adbfor unix-
%ANDROID_HOME%\platform-tools\adbfor windows
Adb forward
In order for chrome-dev-tools to connect to your application it needs to have a named socket set up. Usually the CLI takes care of this, but as we mentioned we won't be using the CLI for building or for debugging. In order to set up this named socket you need to run:
adb forward tcp:<local-host-port> localabstract:<application-full-name>-inspectorServer
<local-host-port>: the port where
chrome-dev-tools will connect locally
<application-full-name>: name of your
application (you can find it in the
AndroidManifest.xml of your application, it's the
value of the 'package' attribute, e.g.
"com.tns.testapplication")
Example command:
adb forward tcp:40000 localabstract:com.tns.testapplication-inspectorServer
Note: This is a one time command and needs to be reran only if adb-server is killed.
Open Google Chrome with debug url
Usually the CLI provides this link so you can open it in Google Chrome, so it's not that different from the normal debug flow.
chrome-devtools://devtools/bundled/inspector.html?experiments=true&ws=localhost:<local-host-port>
<local-host-port>: the same socket we set-up
earlier (40000)
Open this link in Google Chrome and it will automatically
connect to your running application if you've done the
adb forward part correctly. If it doesn't connect
right away, you'll get a button to Reconnect. This
will happen when you try to connect chrome-dev-tools before the
application has started. If you want to stop early in the
execution you can put a debugger; statement in your
JavaScript code.
Note: always start the application before trying to if through Google Chrome.
Now you can debug both the Android Runtime && Android Runtime Binging Generator through Android Studio and your business logic through Chrome-Dev-Tools.
Known issues
Android SDK is not configured properly
To resolve this problem you need to set the Compile SDK Version properties of your application, following these steps: "File" -> "Project Structure ..." -> Select your app -> "Properties" tab -> Set the "Compile Sdk Version" property to "API 26: Android 8.0 (Oreo)"
Error while Installing APK
If you have already ran tns run android before
following those steps, once you hit debug you might get the
"Error while Installing APK" error. The solution is to delete
the problematic folder created from the CLI so it doesn't get in
the way of Android Studio.
adb root && adb shell "rm -rf /data/local/tmp/<application-full-name>"`
Example command:
adb root && adb shell "rm -rf /data/local/tmp/org.nativescript.aaa"
After the folder is deleted successfully from the device, just run/debug again from Android Studio.